May 21, 2016

Deepening Trade Dependency of Nepal

There is growth and development of international trade because of globalization, liberalization, open market and increasing use of technology. Nepal is not exception from the changing world but unable to grab the opportunities created by changing market scenario and still dependent on foreign trade in terms of import. Nepal government is still enjoying the increasing revenue primarily based on custom duties from import.In my viewpoint, there are two layers of dependency, which pushes the Nepalese economy backwards.
At First, Nepal is dependent on trade because production within the country can’t fulfill the demand of goods within the country. Secondarily, there is unavoidable trade dependency with India. Trade with India become compulsion because Nepal as landlocked country share open border of 1876 square kilometers with India. There is Chickens neck "a narrow strip Passage in India : Siliguri Corridor" for direct trade link with Bangladesh and elephant like giant mountains with difficult physical structure to trade with China.
                                                                                           Source : author's computation using data from CBS Nepal(2016)
Over the years, export has almost been stagnated, and the import skyrocketed.The slow growth in export compared to the robust growth in import remains a major concern for Nepal. The average growth in export was 4.2 percent in the last decade whereas growth in import during the same period was 18.2 percent. Nepal’s import is 9 times bigger than export.                     The total export, which used to be 14.58 percent of the Gross Domestic Product (GDP) a decade ago in F/Y 2004/05, has squeezed to 11.67 percent, whereas import has swelled to almost 41.66 percent of GDP in F/Y 2014/15 - in F/Y 2004/05 it was 29.48 percent. During the last decade, import increased by 5.08 folds to Rs. 885 billion whereas export increased by 2.88 folds to Rs 239 billion in F/Y  2014/15. As a result, trade deficit was swelled by 7.35 times in the last one decade and has reached to Rs. 645 billion.The growing and continued mismatch between import and export has resulted in an alarming level of trade deficit in Nepal.

India continued to command a major share in Nepal's foreign trade. With Indian economy's growth accelerating and manufacturing as well as industrial base enhanced further and strengthened, India’s share in Nepal’s total merchandise trade in the last fiscal year increased to 64 percent - in 2003-04, it was 58 percent. China's trading share with Nepal also doubled in the last 5 years to 12 percent and around one fifth of the trade with India. The share of other countries continued to decline to 26 percent of Nepal’s total trade last year, with Nepal shifting its long-running dependency on other countries for the imports of vehicles and machinery, equipment, among others, to India.There are some reasons behind the increase in deepening trade dependency of Nepal.

Consumption Oriented Economy
Economic growth and fixed capital formation is a sluggish but demand in Nepal has remained strong in the last one decade because of remittance earning by migrant workers. If we compare the domestic savings-to- GDP ratio, which is currently around 10.10 percent, and national savings-to- GDP ratio standing at 40.27 per cent, the difference is larger due to remittance. Against the national savings-to-GDP ratio at 40.27 percent, the total fixed capital formation-to-GDP ratio is 22.58 percent, which reflects the failure of Nepali society to make productive use of remittance driven national savings.

Ratio of remittance as percentage of GDP was just 0.46 percent in 1990/91 AD and has significantly increased after the year 2000/01 and Nepal received remittance 29.11 % of GDP worth in fiscal year 2014/15. The ratio of remittance to GDP has highly increased in the nation because the increasing rate of remittance inflow is more than the increasing rate of GDP.
Increasing flow of sweat dollars have induced high consumption, which has in turn fueled higher importing driving the country’s trade deficit even further. But the government is enjoying the revenue generated by the higher imports, generating a kind of complacency, which is also called “Dutch Disease”.

For every rupee of remittance, the government raises 12 paisa through consumption tax (not counting its direct tax contribution). By taking a free ride on remittance and not correcting its negative effects, both fiscal and monetary policies have exacerbated the human exodus and the hollowing-out process. In a country where basic needs are unfulfilled, it is unusual that most remittance (80 percent) is consumed. The problem is not consumption; it is the lack of domestic production and exports to finance consumption. The problem is not low savings either; it is the lack of opportunity to invest and the policy-induced diversion of investment into sectors that do not increase employment and GDP but promote rent extraction.

Remittance revenue is increasing but domestic industries are not capable to seize the opportunities in meeting increased demand of basic goods such as construction materials, household goods and clothing. Then, Nepal had no options but importing such items from other country. Hence trade dependency /import increased by 3.3 time in the last one decade with average annual growth of 15 percent.

Industrial Base is Very Low:
Apart from its contribution to economic growth, production, distribution creation of employment opportunities to the people, the private sector has an important role to play in the service delivery to the people through the market mechanism. Nepal’s manufacturing sector has not seen a robust growth. Even the growth in service sector remains in conventional sectors, not in the modern sectors.  Shrinking industrial activities is one of the disturbing features of Nepal's economy. The industrial sector that used to contribute 18 percent to the GDP a decade ago has squeezed - 15 percent in last year. The contribution of industry group to GDP stood 14.1 percent in 2010-2011 whereas the contribution of manufacturing to GDP was 6.5 % - annual average growth rate of 2.5% in the manufacturing sector in the last decade. 

         Source :author's computation using data from CBS Nepal(2016)
A decreased from 10 percent to 6.5 % of the manufacturing sector's contribution to GDP indicates that industrialization in Nepal is very much sluggish. This also indicates that Nepal's industries failed to capitalize the opportunities unveiled by the remittance-fueled consumption in the domestic economy, compelling the domestic economy to depend on imports to meet increased internal demand, let alone producing goods for exports. Industrial base become very poor because of poor investment, lack of raw materials, worst condition of energy, Increasing production cost, frequent strikes , blockade and government change.

Poor state of Infrastructure and policy support

The biggest constraint that is limiting the prospects of industrialization in Nepal is current status of infrastructure, which is very poor.

Nepal consistently stands out as a country with one of the poorest logistical and enabling trade infrastructure in the world. Nepal ranked 105 out of 160 countries with LPI score 2.59 in Logistical Performance Index (LPI) in 2014(World Bank).Lack of access to sea that adds around 15% to transit related transit cost in export compared to the countries that have access to sea. There are other major problems to develop strong industrial base are:
  • Shortage of electricity:The shortage of electricity is forcing firms to operate at far less than the captive capacity. According to Enterprise Survey 2013, the percentage of firms owing or sharing generator jumped to 50.5% in 2013 from 15.8% in 2009 and almost 69 % firms identified electricity as a major constraints in 2013.
  • Inadequate Transportation: Inadequacy of existing transport infrastructure and logistical hassles has been increased product costs and export competitiveness. About 1/3 rd of manufacturing firms identified bad transport facilities as a major constraints in 2013.
  • Lack of adequate facilities for warehouse, handling equipment’s, scanning machines and testing laboratories have limited the prospects of export promotion.
  • Poor financial access: There is very few practice of consortium financing by banks for huge projects and they rarely invest for small entrepreneurship development, because they are unable to put sufficient collateral to access  financial source for new venture investment.
  • Underdeveloped Capital market: Nepal’s capital market is relatively under developed. This has resulted in low capital formation and in turn low investment.
Policy inconsistencies and implementation paralyses is another major problems in Nepal’s increasing trade dependency. After two decades of delay, the establishment and ope rationalization of Special Economic Zone (SEZ) in Bhairahawa. Similarly the “one window” facility for exporters and provision like “No Work No Pay” remains unimplemented. There is possibility that existing set of policies and sect oral promotion strategies may be termed ineffective without first fully implementing them and taking adequate time to evaluate actual output.

Poor Business Doing Environment
The World Bank’s annual Doing Business Report shows Nepal’s ranking at relatively low level. Nepal has the highest export lead time (days) in the region, as it needs 11 documents, 42 days and costs US$2,295 to export a container. According to doing business report 2016, for easing doing business ranking Nepal stands at 99 position out of 189 countries having DTF (Distance to Frontier) score 60.41.
Nepal’s long running political instability in the name of democracy has produced many negative effects to the economy.Industrial unrest's and strikes that are often organized by sister organizations of leading political parties. As a result, industrialists are often forced to talk to outsiders such as political leaders to settle unrest's and strikes in their factories.

Unpredictable strikes and unrest's have made exporters struggling all the time to meet supply deadlines set by foreign buyers. Such activities also further add to cost of production and erode competitiveness. Similarly, rigid labor policy that bars enterprises to adjust labor force as per the change in demand in the market. As per existing law, employees get permanent status after working for more than 240 days and after getting a permanent status, they can’t be fired until they are proven engaged in criminal activities. The provision has become a recipe of disaster for order-based industries such as ready made garments and woolen rugs and season-based industry such as tourism and hotels. Enterprises are compelled to keep on paying to the laborers even during the lean seasons, something that swells cost of doing business. Garments and Pashmina Productions are hit by the shortage of workers of all skills range. There is shortage of labor due to large scale migration.

 Dependency With India
Since transit through china is virtually impractical. India is viable for all commercial flows.  Nepal and India are two neighbors having unique relations dating back to antiquities perhaps even before the dawn of human civilization. Nepal share an open border of 1876 square kilometers with India and Nepalese currency is pegged with Indian currency. India is Nepal’s largest trade partner and source of foreign investment. Nepal's economic development has been inextricably linked with India. 

Source :author's computation using data from NRB(2016)
India is the largest single partner in Nepal's foreign trade and Nepal's dependence upon India for essential commodities has been immense India is also the only transit providing country for Nepal.Nepal;s transit trade is routed through twenty two designated routes from India-Nepal border to the port of Kolkata/Haldia. In addition, Nepal's trade with and through Bangladesh also transits through India. Increasing trade dependency on India because lack of development of productivity and competency compared to Indian products.
Nepal's dependence on India took an upward trend after the southern neighbor adopted an open market policy. The central bank's report shows that Import from India in F/Y 1989/90 is 4674.5 million rupees and it becomes 491655.9 million rupees in 25 years period of  time at F/Y 2014/15 with average growth of 20 percent. Trade deficit with India 4072 million rupees in F/Y 1989/90 and deficit mounting 435791.3 million rupees in 25 years. But export to India in F/Y 2014/15 it becomes 55864.6 million rupees. Which reflects very poor growth in exports and increasing trade deficit with India.                                                                        Source :author's computation using data from NRB(2016)

This figure reflects that there is huge trade deficit with India  than other third countries. Which is not a new phenomenon and it has been increasing in line with our excessive dependence on the Indian economy. High trade deficit and an unfavorable balance of payments situation signals troubles in an economy—especially its capacity to ensure exchange rate and macroeconomic stability, and to sustain imports levels to support rising domestic demand for foreign goods and services. There is consensus among policymakers and analysts that the rising trade deficit is unsustainable. It needs to be re-balanced. The only way we can correct trade balance with India is to increase exports. India has already opened up its market for most of the goods exported by Nepal. Unfortunately, Nepal has failed to advantage of the opportunities.

After signing the transit agreement with china, it is widely anticipated that Nepal will do business through Chinese ports and its dependency on India will reduced. Such interpretations, particularly in Indian circles, are beyond the ground realities and one should understand that a transit treaty does not necessarily  measure up to implementations.

Feb 13, 2016

India's Transit warfare against Nepal


The world congratulated Nepal for her success of implementing new constitution but Nepal’s so called roti-beti closest neighbor sent a cold note and a mild warning. India has unofficially closed all the trade routes and tries to interfere with landlocked Nepal’s sovereignty and internal affairs. According to public International law, it is illegal for one state to impose an economic blockade on another. There are couple of international instruments which argues that land locked countries should be given transit access as international customary law. This is not the first time India blockade to Nepal. Nepal frequently mistreated by the closest neighbor India’s transit warfare.

Nepal had got the nearest transit point through India since the British regime as per the Friendship
treaty of 1923.Modern Nepal-India relationship has been guided by Peace and Friendship Treaty 1950 which allowed nationals of both countries to visit each nation without visas or passport and followed open border policy. National of both countries may work and pursue occupation in respective countries. This treaty also highlights on security, trade and transit between Nepal and India. The Trade and Transit treaty was renewed in the year 1960 and 1971.

The trade and transit treaty was bifurcated and separate transit treaty was signed in year 1978. The new transit treaty recognized the transit right of landlocked country which was separate and permanent in nature than bilateral trade. In the year 1989, the transit treaty of 1978 was unilaterally abrogated by India refusing to sign separate transit treaty. However, in 1991 Nepal and India continued separate transit treaty with the major provisions of renewal. In 1999 the transit treaty was signed with the provision of automatic renewal after every seven years.

However, Nepal has secured 15 transit routes for traffic in transit though Nepal has exercised only 7 routes presently. And, also India somehow has shown its liberalism by providing transit facilities through Radhikapur to Nepal by which Nepal has access to International Trade with Bangladesh and other countries. Moreover, separate transit treaty from other bilateral issues is one of the important achievements of Nepal with the provision of automatic renewal provision in every 7 years as mentioned.

Jun 12, 2015

Annual Report 2015 Highlights : World Customs Organizations

About World Customs Organization

Established in 1952 as the Customs Co-operation Council, the World Customs Organization (WCO) is an independent intergovernmental organization whose primary mission is to enhance the effectiveness and efficiency of Customs administrations worldwide.

As the only intergovernmental organization specialized in Customs matters, the WCO established its headquarters in Brussels in 1952, and currently represents 180 Members across the globe at all stages of social and economic development. As the global centre of Customs expertise and the voice of the international Customs community, the WCO provides an ideal forum for Customs administrations and their stakeholders to hold in-depth discussions, exchange experiences, and share best practices on a range of international Customs and trade issues.

WCO Mission Statement 
The WCO provides leadership, guidance and support to Customs administrations to secure and facilitate legitimate trade, realize revenues, protect society and build capacity. 

WCO Vision Statement
Borders divide, Customs connects. Dynamically leading modernization and connectivity in a rapidly changing world.

WCO Values 
WE are a knowledge-based and action-oriented organization. We believe in transparent, honest, and auditable governance procedures. We are responsive to our Members, stakeholders in trade, and society. We capitalize on technology and innovation.

Major Highlights of Annual Report 2015
  • More than 8,40,000 Customs officers around the World.
  • 13.3 Percent of head of Customs are Female
  • Composition of Customs Revenue : 43.47% custom duties, 24.93% General Custom Duties,16.66% special consumption taxes
  • More than 60% of Customs Administrations use custom-made automated clearance systems
  • 45% of Customs Administrations are embedded within a ministry 28.3% are Revenue authorities 25% are Customs agencies
  • 610 million Customs declarations excluding postal items and express consignments
  • More than 40% of Customs Administrations use Single Window systems
Each year, the WCO opens its doors to hundreds of representatives from Customs administrations, other government agencies, the private sector, associations, and universities keen to discover more about the Organization. Such visits allow the Organization to showcase the diverse activities and programmes underway and to foster important links with institutions vital to the world of international trade and Customs.for detail follow the following link.

Jun 2, 2015

Customs Environment Scan 2015

Customs is an authority or agency in a country responsible for collecting tariffs and for controlling the flow of goods, including animals, transports, personal effects, and hazardous items, into and out of a country. World customs organization is scanning the customs environment for 2015.

The 2015 Customs Environmental Scan includes political, social, environmental, and administrative developments during 2014 that directly or indirectly related to Customs.

Macroeconomic Indicators

International trade slows
The World Trade Organization (WTO) reduced their forecast for world trade growth in 2014 to 3.1% (down from the 4.7% forecast made in April 2014). “International trade grew by only 2.8% in 2012 and 3.2% in 2013 in dollar terms, even as global GDP grew by 3.1% and 3.2%. When measured in terms of volume, trade is still growing faster than the world economy, but by a decreasing margin. Having soared from 40% of the world’s GDP in 1990 to a peak of 61% in 2011, trade has fallen back slightly to 60%, the same level as in 2008” (The Economist, 13 December 2014).

Peak Trade
Some economists think the slowdown in international trade growth is structural, and have accordingly accorded the term peak trade to describe this trend.

Major economies.
The US economy continued to strengthen with GDP growth of 2.4% in 2014 and unemployment rates under 6%. The European Union continued to feel the effects of deflation, unemployment exceeding 11%, and anemic economic growth. Japan introduced more fiscal stimulus to help prime economic growth. India and China both had economic growth of approximately 7.5% in 2014.

Rise of the US dollar.
The US dollar (USD) experienced a sharp appreciation against other currencies, particularly the Euro and the Japanese Yen. The USD rose to 1.19 Euro in January 2015, the highest in nine years. This will result in US exports becoming more expensive while European and Japanese exports will be less expensive. The rising USD may also have an impact on revenue collection for Customs administrations; depreciation of major currencies against the USD may improve Customs duty collection in these countries.

Oil prices plummet
The plunge in oil prices will have economic, fiscal, and geopolitical impacts. Countries that receive a substantial amount of Customs duties from oil imports may experience downward pressure on their overall revenue collection. Reduced oil prices will see a consequent reduction in transport costs, which may encourage trade. On the other hand, volatile oil prices have been identified as discouraging trade.

Oil exporters
may experience a decline in national income. Countries which consume a significant amount of oil may experience new opportunities for allocation of the ensuing savings previously spent on fuel. Decreased oil prices are harming the potential of new extraction techniques such as fracking (shale gas) that generally cost more than conventional oil production.


Trade Agreements

WTO Trade Facilitation Agreement (TFA).
With the recent adoption of the TFA’s Protocol of Amendment, the TFA is back on track. While implementation will likely take many years in developing countries, the process will positively impact donor funding for Customs reform and modernisation.

Free Trade Agreements (FTAs) or Regional Trade Agreements (RTAs).
FTAs as a whole continue to increase. For countries signing FTAs, this will impact the level of revenue collected. According to the WTO, “as of 8 January 2015, some 604 notifications of RTAs (counting goods, services and accessions separately) had been received by the GATT/WTO. Of these, 398 were in force. These WTO figures correspond to 446 physical RTAs (counting goods, services and accessions together), of which 259 are currently in force.” (WTO website, 2015).


There are currently two major RTAs being negotiated. The Transatlantic Trade and Investment Partnership (TTIP) is a proposed FTA between the European Union and the United States. The Trans-Pacific Partnership (TPP) is a proposed trade and investment agreement which currently counts Australia, Brunei Darussalam, Canada, Chile, Japan, Malaysia, Mexico, New Zealand, Peru, Singapore, the United States, and Vietnam participating as negotiating partners.

Euroasian Economic Union (EEU).
The EEU, which succeeds the Eurasian Customs Union, became operational on 1 January 2015. The EEU Members are Russia, Kazakhstan, Belarus, and Armenia with Kyrgyzstan scheduled to join in May 2015. EEU Members have lifted some internal Customs barriers and harmonised some procedures. The agreement focuses on the free flow of capital, goods and services, and workforce throughout a common market with an estimated output of $2.4 trillion, comprising more than 170 million people.

Trade in Information Technology.
In late 2014, China and the US reached a deal which could lead to a proposed treaty on trade in information technology among a coalition of willing WTO Members (The Economist, 13 December 2014).

Tax revenue
Revenue Sharing.
The process in which one country collects the duties owed to another country will continue to have implications for Customs. In some regions, where Customs revenue still accounts for an important share of the national budget, this revenue sharing concern is one of the major obstacles to regional Customs integration.

Political, Social, and Environmental Influences
Security.
Due to acts of terrorism and violent extremism, several governments moved to increase data collection for security purposes, such as requiring the submission by airlines of API and PNR data.

Narcotics Smuggling.
The international trade in illegal narcotics continued. Several countries in Latin America are softening drug laws. Two US states (Oregon and Alaska) and one city (Washington, DC) joined Colorado and Washington State in introducing legalisation of recreational and medicinal marijuana. This trend is important for Customs given that marijuana is one the most significant drugs in terms of seizures.

Cross-border e-commerce.
Cross-border e-commerce is increasing at an astonishing rate around the world due to a combination of factors such as continuously advancing internet technology, economic development in developing countries, and expansion of express delivery services and mobility of labor force. In particular, increases in cross-border e-commerce in Asia are noticeable. Cross-border e-commerce accounts for 10 to 15 percent of total e-commerce volume, depending on the region. By 2025, Asia may account for some 40 percent of the cross-border volumes and Europe may account for about 25 percent, followed by North America at 20 percent. A dramatic increase in cross-border e-commerce impacts Customs administrations in terms of revenue collection, supply chain security, and allocation of Customs resources.

Open data and “democratic knowledge
The social demand on public sector transparency is increasing, including in the fields of taxation and trade. Some administrations have launched or are launching initiatives to share data and policy simulation engines with the general public. Some experts and policymakers (i.e. EU, UNCTAD, and the World Bank) are advocating for the exploration of firm-level data to support reflection on trade and Customs policies. The concept of “firm-level data” is also increasing. Customs administrations maintain crucial databases (ACS) related to international trade and will be asked to contribute.

Impact of Ebola.
To halt the spread of the virus, the countries most affected by the Ebola virus disease implemented quarantines in areas where risk of infection is high while neighboring countries imposed restrictions on the movement of people and goods, including border closures. These measures, in turn, have reduced internal and regional trade, transport, and tourism. In particular, it is anticipated that there has been great damage to informal trade, which experts estimate ranges from 20 to 75 percent of GDP for West African countries.

Wildlife smuggling.
Many endangered species, such as elephants, rhinos, tigers, and jaguars, face extinction in the near future due to the illegal trade in wildlife.

Tobacco Control
Customs administrations and other revenue agencies continued to collect billions of dollars annually in taxes on tobacco products which are used to fund many government services. Evidence shows that tobacco taxation is a core tool in reducing the prevalence of smoking, and thus reducing tobacco-related diseases such as cancer, heart disease, stroke, bronchitis and emphysema. Approximately 6 million people were killed globally in 2014 by cigarette related diseases.

A growing number of countries (Australia, Ireland, UK, and France) have adopted plain (standardized) packaging of cigarettes. Preliminary data is being reported from Australia since the passage of its plain packaging law in December 2012. The Australian Bureau of Statistics reported that the December 2014 quarter showed a 2.9% decrease in tobacco consumption and a 12.2% reduction from December 2013 to December 2014. Australian Customs and Border Protection reported in its most recent annual report (2013-2014) decreases from 2012-2013 to 2013-2014 in several illicit cigarette trade indicators, including the level of tobacco seized (down from 183 to 178 tonnes); the number of cigarettes seized (down from 200 to 147 million of sticks); and duty evaded (down from 151 to 139 million Australian dollars).

Climate Change.
2014 was the warmest year on record. 9 out of the 10 warmest years ever came in the last decade. Atmospheric carbon dioxide (CO2) concentrations, which were 280 parts per million (ppm) in the pre-industrial era, are now 400 ppm. Extreme weather events due to human induced climate change are increasing, necessitating fast Customs clearance of natural disaster relief goods. A recent agreement between China and the United States commits for the first time both countries to emission reductions.

Administrative Influences
Corruption.
Customs corruption continues to be a problem as evidenced by NGO and media reports. The G20 has placed corruption on its agenda for discussion. The WCO continues to promote performance measurement contracts (PMC) as a tangible measure for reducing corruption.

Organizational risks to Customs.
Several Customs administrations and tax authorities are merging into revenue authorities in Eastern Europe. This follows the major wave of the establishment of revenue authorities in Africa in the 1980s and 1990s following advocacy by the IMF. Small countries frequently merge two fiscal authorities in order to save administrative costs.

Source : World Customs Organization

May 29, 2015

Quake opened the Road to Transformation

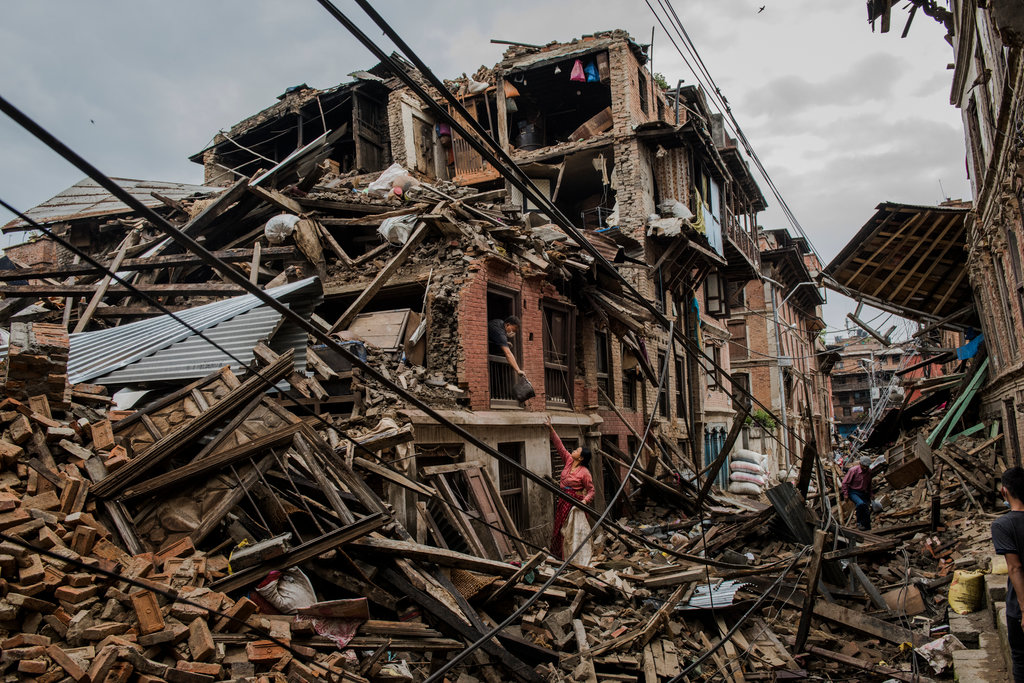
More than eight thousand people were killed in the April 26 earthquake measuring 7.6 Richter scale has shattered much of the central part of Nepal and left over more than twenty thousand people injured and 0.5 million people homeless. We have not faced this type of great disaster since 1934 AD. The loss, damage and destruction wrought by the current earthquake have impacted the government and people of Nepal severely.


This unprecedented calamity has struck the country just ten year after the great political revolution of 2062/63 BS and country has some signs to hope. We are proud to our achievements, strong against exploitation and long patience to get new constitution. A country that was never colonized  has long been isolated, but its history and fate enter wined with the India and the other powerful countries. We feel it and know it should not be this way, we know things should be different. 

So much of the discussion has been about the emergency effort, about food and water, now it’s starting to shift to long term planning. It’s time to think  how to provide shelter to those left homeless by the quake is becoming urgent with the approach of the country’s rainy June/July where the central hemisphere’s upper belt is often battered by floods and landslides. Second, we will need to explore options for low-cost housing, rehabilitate physical infrastructure and reinstate schools and health posts.The question is how Nepal can recover and be built back better than it was before.

This catastrophe presents an opportunity. What are we going to do is to contribute to realizing a new vision for Nepal ? There is something like a clean slate now. Physical infrastructure of the Nepal state has collapsed.  Physical infrastructure can be rebuilt; the more difficult task will be to continue building the human infrastructure and capacity of Nepali state. It will take a lot of money, creativity and vigilance and sustained commitment to rebuild Nepal.

Governance
Nepal is a poor country long plagued by governance issue.  Nepalese Bureaucrats and leaders were long been blamed on their corrupted and traditional thinking.  Nepal needs to improve governance by empowering the bureaucrats and leaders. There is a hope that this could happen. The government need space to lead but and this includes the ability to plan and execute budgets (under close scrutiny, of course). Doing so will require talented and accountable manager.  The leader having diamond like leadership characterstics definitely can lead the country in this difficult situation and can be conductor of people's hope .

Diaspora
Perhaps no country sends as large section of its workforce abroad as Nepal. The Diaspora has always been one of the Nepalese economy’s most solid pillars; official remittance inflows to Nepal reached 28.8% of GDP in 2013, which makes Nepal the third largest remittance recipient in the world. Migrants remitted an estimated US$5.9 billion to Nepal in 2014.. Now it is time to fully tap the skills and the resources of the Nepali Diaspora in the reconstruction effort.

Business Environment
Prior to earthquake, investment in Nepal was on the upswing. There was also growing interest in promoting tourism. Empowering people and promoting self-sufficiency by developing entrepreneurship through local levels is the key to sustainable development. I sincerely hope that business and tourism opportunities will rebound.

Diplomacy
Nepal as “yam between two boulders” has also been facing lots of problems because of inefficiency in diplomatic dealings. Both India and China are emerging economic superpower in coming years. Major concern must be maintenance of balanced and fruitful economic diplomacy to gain from emerging economic powers. Big markets are at doorsteps. There is some opportunity for Nepal as a landlocked country.

In addition to this, Nepal need to coordinate the global aid is essential. Different countries are interested to join reconstruction effort of Nepal. Of course, they have some interests but coordinating them tactfully by Nepalese leaders is essential.

Indubitably, we are severely affected, but we have to accept that creation and destruction are the Will of the Almighty. Natural disasters like earthquake, floods, landslides and lightening are frequent, causing colossal physical damages and losses of human lives.But the challenge now is to transform this devastation into an opportunity for development. We have unique opportunity to get right. Now the challenges is to make sure we are never in this situation again. It is difficult to think about long term recovery given all the present suffering. Yet if we are to build a better Nepal, we must. The reality cannot be changed, but a better future can be built through our positive mindset. Once the mindset of Nepalese changes, everything on the outside will change along with it.

After Ten Year : "The Development must overshadow Grief" in Nepal.

Jul 21, 2014

Monetary Policy 2014/15 Highlights

Nepal Rastra Bank has been adopting monetary policy the objectives of maintaining price and external sector stability, financial stability and facilitating high and sustainable economic growth, increasing financial access, control inflation, maintain external and financial sector stability, utilize credit in the productive sector and expand financial access.

The monetary policy for 2014/15 has been formulated based on the analysis of domestic economic outlook as well as changes in international economic situation. Likewise, the selection of monetary policy stance and instruments has been made consistent with the objectives and priorities undertaken by the government budget for 2014/15.Certain major concern areas of NRB in current monetary policy are interest rate stability, rein inflation at targeted level, maintain external stability, encourage merger of BFIs, financial sector stability, promoting credit to productive sector, financial service expansion, financial literacy and increase financial inclusion, managing the excess liquidity created by remittances. Following are major provisions on monetary policy 2014/15.

NRB has announced contractionary monetary policy with the objective to control the credit flow to unproductive sector because of excess liquidity created by remittances in the financial market. As per policy provision, there will be provisions to sanction sufficient fund from banking sector to achieve targeted economic growth. Major highlights of monetary policy 2014/15 are:

Jul 19, 2014

Failed Economic Development of Nepal

Economic development is a process whereby an economy's real national income as well as per capita income increases over a long period of time. Following figure represents the percapita GDP of Nepal, which shows its not much increase during long period of time.

Economic development, as it is now generally understood, includes the development of agriculture, industry, trade, transport, Tourism, power resources, etc. It, thus, indicates a process of development. The sectoral improvement is the part of the process of development which refers to the economic development. In context of Nepal, sector wise growth during FY 2013/14 is as follow:

The structure of Nepalese economy has been changing gradually. Contribution of agriculture and industry sectors to GDP showed a declining trend while that of services sector showed the opposite.