Economic development is a process whereby an economy's real national income as well as per capita income increases over a long period of time. Following figure represents the percapita GDP of Nepal, which shows its not much increase during long period of time.

Economic development, as it is
now generally understood, includes the development of agriculture, industry, trade,
transport, Tourism, power resources, etc. It, thus, indicates a process of development. The sectoral
improvement is the part of the process of development which refers to the
economic development. In context of Nepal, sector wise growth during FY 2013/14
is as follow:

The structure of Nepalese economy has been changing gradually. Contribution of agriculture and industry sectors to GDP showed a declining trend while that of services sector showed the opposite.
Agriculture
Production of the
agriculture sector is estimated to grow by 4.7 percent in current fiscal year
2013/14. Such growth rate was just 1.1 percent last year. Contribution
of agriculture and industry sectors to GDP showed a declining trend.


Industry
Among
the non-agriculture sector, growth rates of industry and services sector are
estimated to remain at 2.7 percent and 6.1 percent respectively in current
fiscal year while these figures were 2.5 percent and 5.2 percent respectively
in the previous fiscal year. Growth rates of Electricity, gas and water,
construction wholesale and retail trades, hotel and restaurant, fiscal
inter mediation, real estate, education sectors under the non-agriculture sector
have increased as compared to the previous year.The registration of different type of industries are decreasing trend.

Trade
The volume of world trade in goods and services that extensively declined in 2012 as compared to 2011 improved marginally in 2013. The world trade in goods and services recorded a growth of 3.0 percent in 2013 as compared to 2.8 percent in 2012 and 6.2 percent in 2011. The export of developed economies rose by 2.3 percent while that of emerging and developing economies grew by 4.4 percent in 2013. Likewise, the imports of developed, emerging and developing economies grew by 1.4 percent and 5.6 percent respectively in 2013. T IMF has made a forecast of some progress in the world trade in 2014. The trend in the world trade is depicted in the table below.

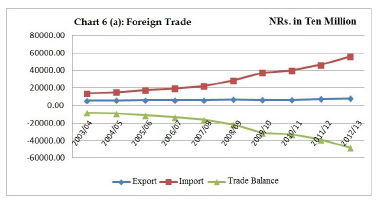
Merchandise exports grew by 19.4 percent to Rs. 60.9 billion during the first eight months of the current fiscal year 2013/14 against its growth of 5.0 percent in the same period of the previous fiscal year. Total imports increased by 27.0 percent to Rs. 457.85 billion during the first eight months of current fiscal year 2013/14 compared to 22.1 percent rise during the same period of previous fiscal year. The trade deficit on grew by 28.2 percent to Rs. 396.96 billion during the first eight months of the current fiscal year 2013/14, against 25.5 percent growth (Rs.309.55 billion) during the same period of the previous year.The export/import ratio dropped to 13.3 percent during the review period due to the higher base and growth rate of imports compared to that of exports. Such ratio was 14.1 percent in the same period of previous fiscal year.
The volume of world trade in goods and services that extensively declined in 2012 as compared to 2011 improved marginally in 2013. The world trade in goods and services recorded a growth of 3.0 percent in 2013 as compared to 2.8 percent in 2012 and 6.2 percent in 2011. The export of developed economies rose by 2.3 percent while that of emerging and developing economies grew by 4.4 percent in 2013. Likewise, the imports of developed, emerging and developing economies grew by 1.4 percent and 5.6 percent respectively in 2013. T IMF has made a forecast of some progress in the world trade in 2014. The trend in the world trade is depicted in the table below.
Merchandise exports grew by 19.4 percent to Rs. 60.9 billion during the first eight months of the current fiscal year 2013/14 against its growth of 5.0 percent in the same period of the previous fiscal year. Total imports increased by 27.0 percent to Rs. 457.85 billion during the first eight months of current fiscal year 2013/14 compared to 22.1 percent rise during the same period of previous fiscal year. The trade deficit on grew by 28.2 percent to Rs. 396.96 billion during the first eight months of the current fiscal year 2013/14, against 25.5 percent growth (Rs.309.55 billion) during the same period of the previous year.The export/import ratio dropped to 13.3 percent during the review period due to the higher base and growth rate of imports compared to that of exports. Such ratio was 14.1 percent in the same period of previous fiscal year.

Tourism
Observation of the trend of tourists arrival for the past 10 years until 2012 showed an increasing trend, the number of tourist arrivals between January 2013 and 2014 totaled 797,759. This figure is less by 0.7 percent as compared to the corresponding period (January 2011 to January 2012) of last year.

The average length of stay per tourist during the period of January 2012 to January 2013 stood at 12.6 days. Though this figure is slightly lower as compared to that of previous year, percapita length of tourists stay for the last 10 years has averaged around 12 days.

Foreign Employment and RemittancesTotal of 109 countries are opened for foreign employment by now. Most of the youth labor force is attracted towards foreign employment as a result of inability to create employment opportunities in the domestic labor market and increased temptation of youths in foreign employment. Every day about 1,500 youths are estimated going abroad from Nepal for foreign employment. Likewise Despite the annual entry of more than 450,000 labor force in the labor market, the employment growth rate is only 2.9 percent.

Foreign exchange earnings from the tourism sector stood at Rs. 30.70 billion in fiscal year 2011/12 while such earnings in the fiscal year 2012/13 increased by 3.50 billion (11 percent) reaching a total of Rs. 34.21 billion. In the first eight months of fiscal year 2013/14, foreign exchange earnings from tourism sector recorded Rs. 30.43 billion.

Likewise, remittance inflow has recorded sharp growth of 34.1 percent to Rs. 356.72 billion in the review period as against 22.2 percent growth in the corresponding period of previous fiscal year. Balance of Payment in the first eight months of the current fiscal year 2013/14 recorded a surplus of Rs. 102.81 billion as compared to the surplus of Rs. 11.78 billion in the same period of previous fiscal year.During the review period, the amount received in capital account as net capital transfer totaled Rs.12.64 billion. The capital account surplus stood Rs. 5.16 billion during the same period of the previous fiscal year.

These above figures represents the Nepal's failed development in long period of time. No any improvements in any sector.There are lots of things needed to change but the government budget of FY 2014/15 also cant address these things.Current budget is just like the fulfilling formality and not offering incentive to any sector.If monsoon become favorable and agricultural growth is achieved than achievement of 6% growth is not difficult task. But as governments three year interim plan (2014-2016) goal is to upgrade in developing country from least developed status, the growth must be 8% later year Nepal needs 9-10 % growth. Question remains, Is this achievable in later years? If this type of aid dependency trend, increasing trade deficit, decreasing productivity of industry sector and consumption led growth continues dream of upgrading into developing country will still remain in dream in 2022 AD.
SOURCE : Economic Survey (2013/14),Ministry of Finance
No comments:
Post a Comment